How can renewable electricity be a negligible contributor of electricity, but, at the same time, have grown so big, it’s difficult for further growth? For updated versions of the graphs below, see this reference:
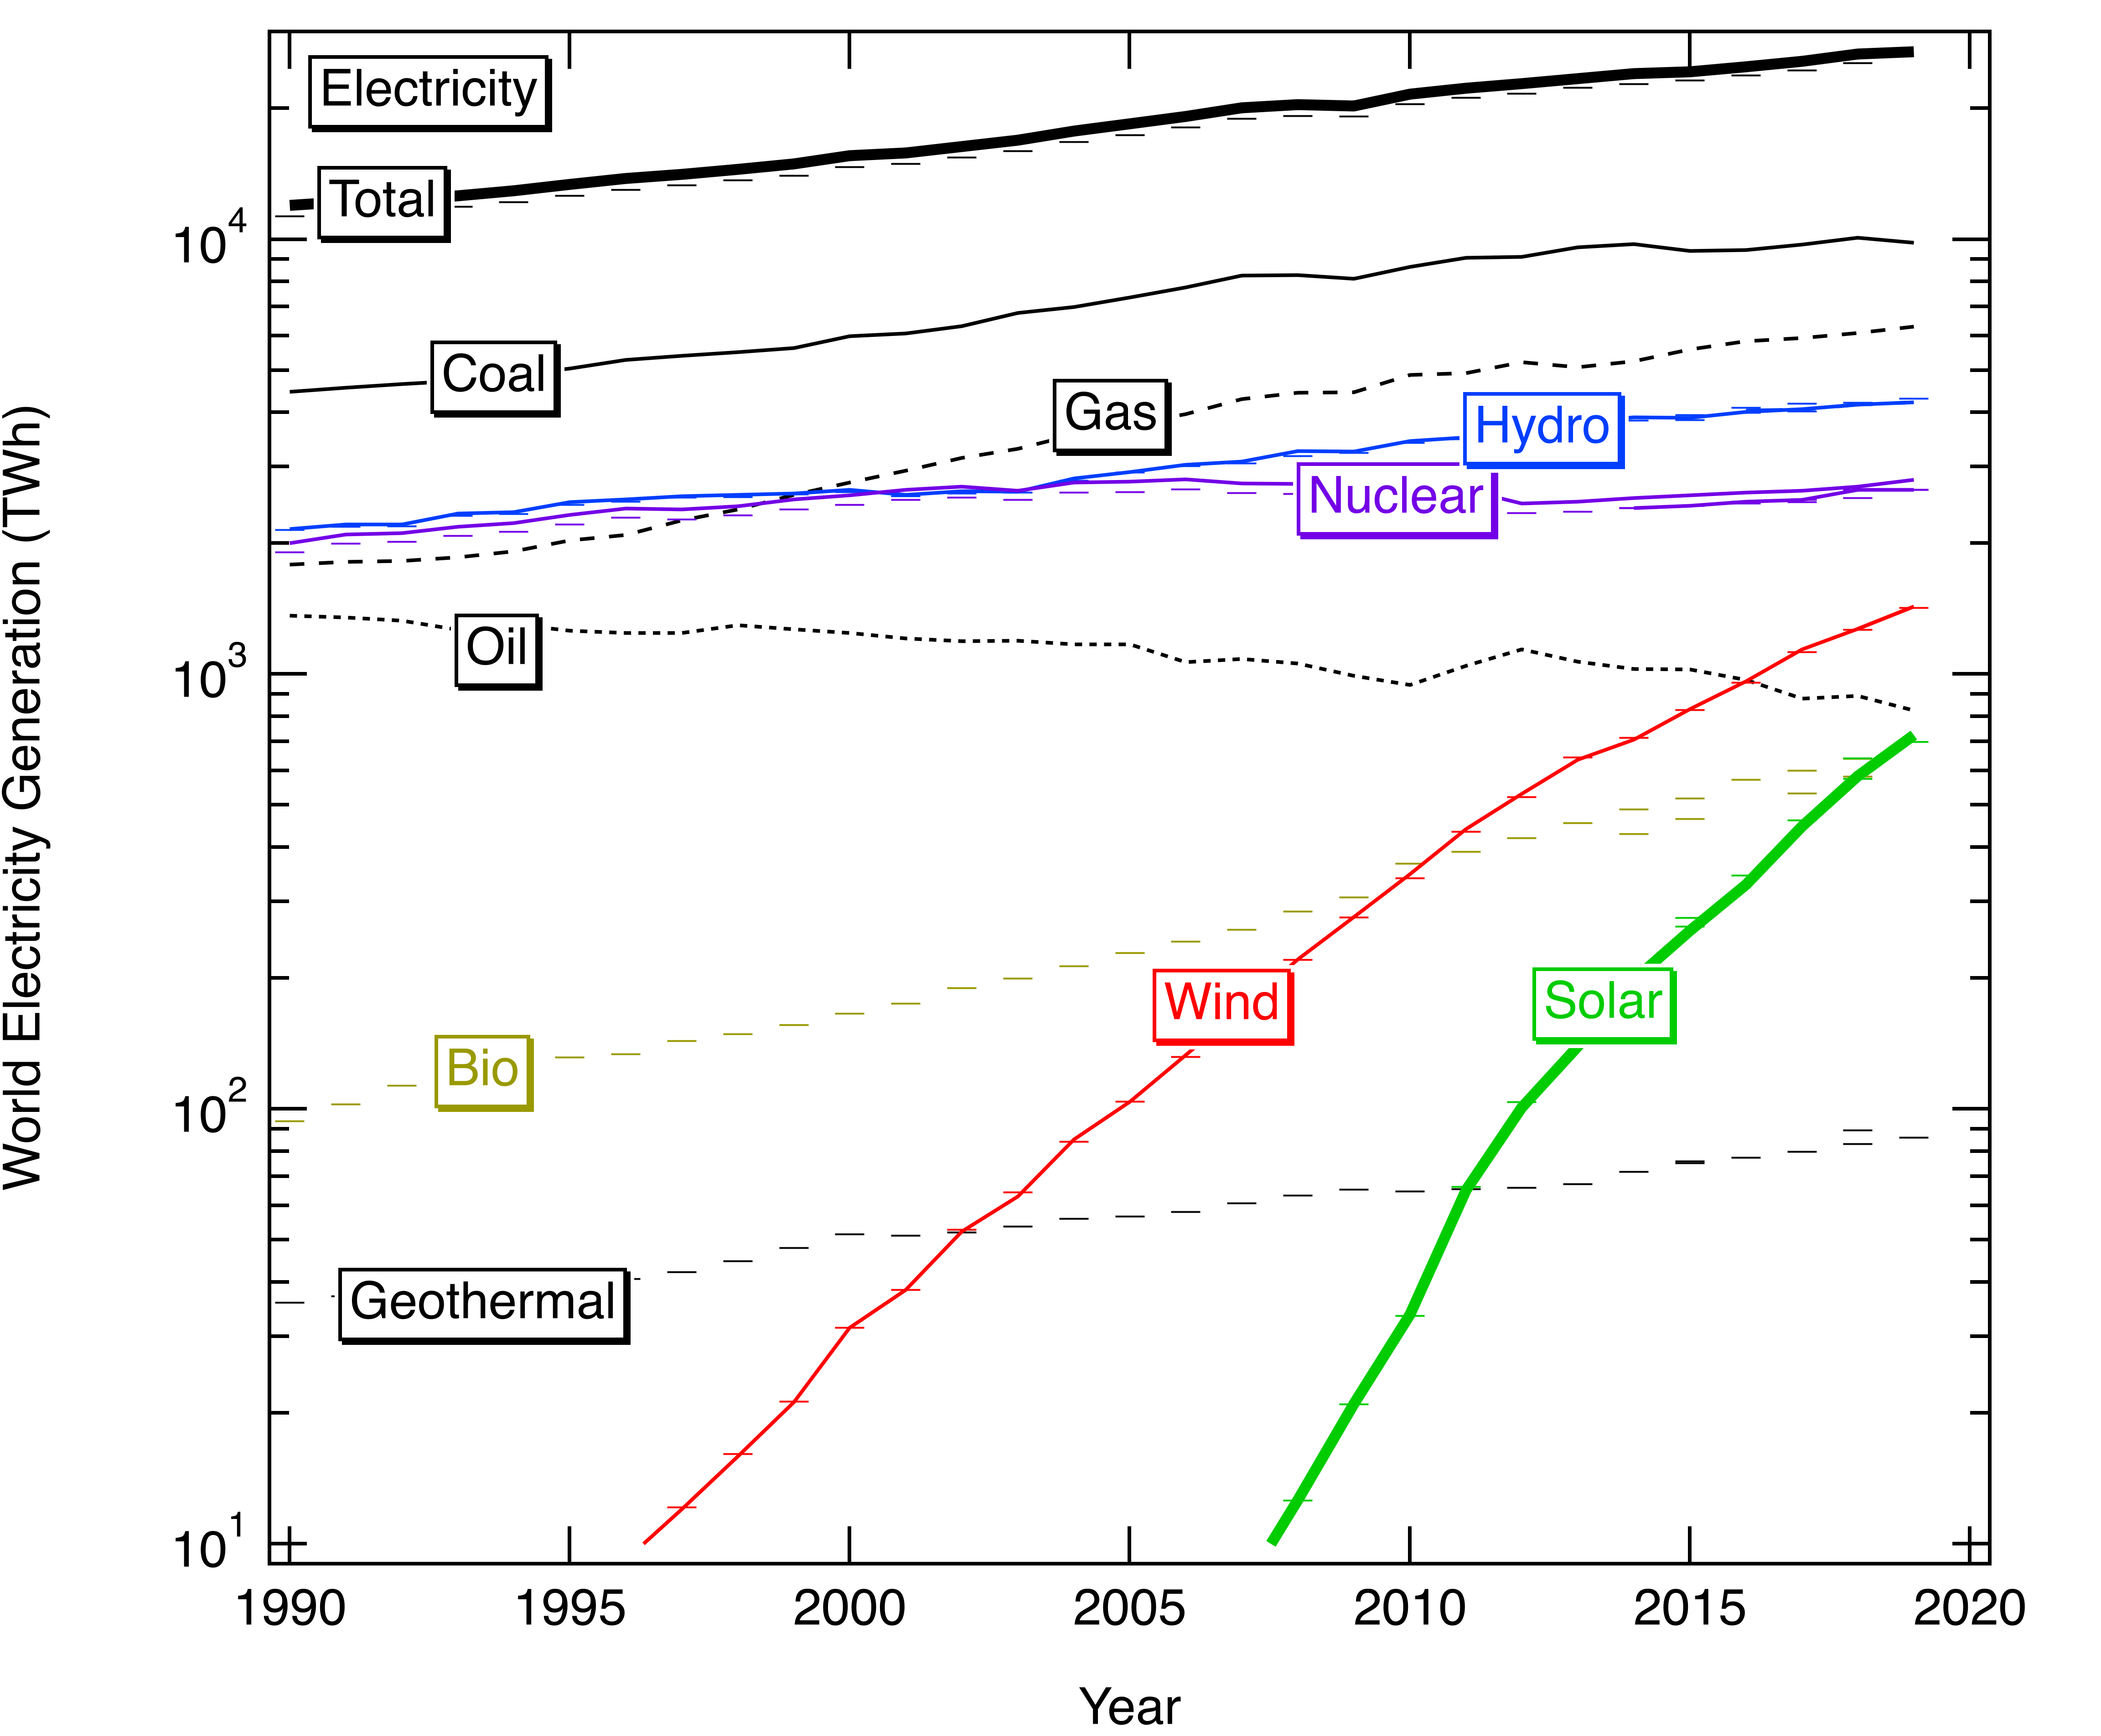
Generation of renewable electricity is relatively expanding rapidly but is still small as shown by the logarithmic graph.
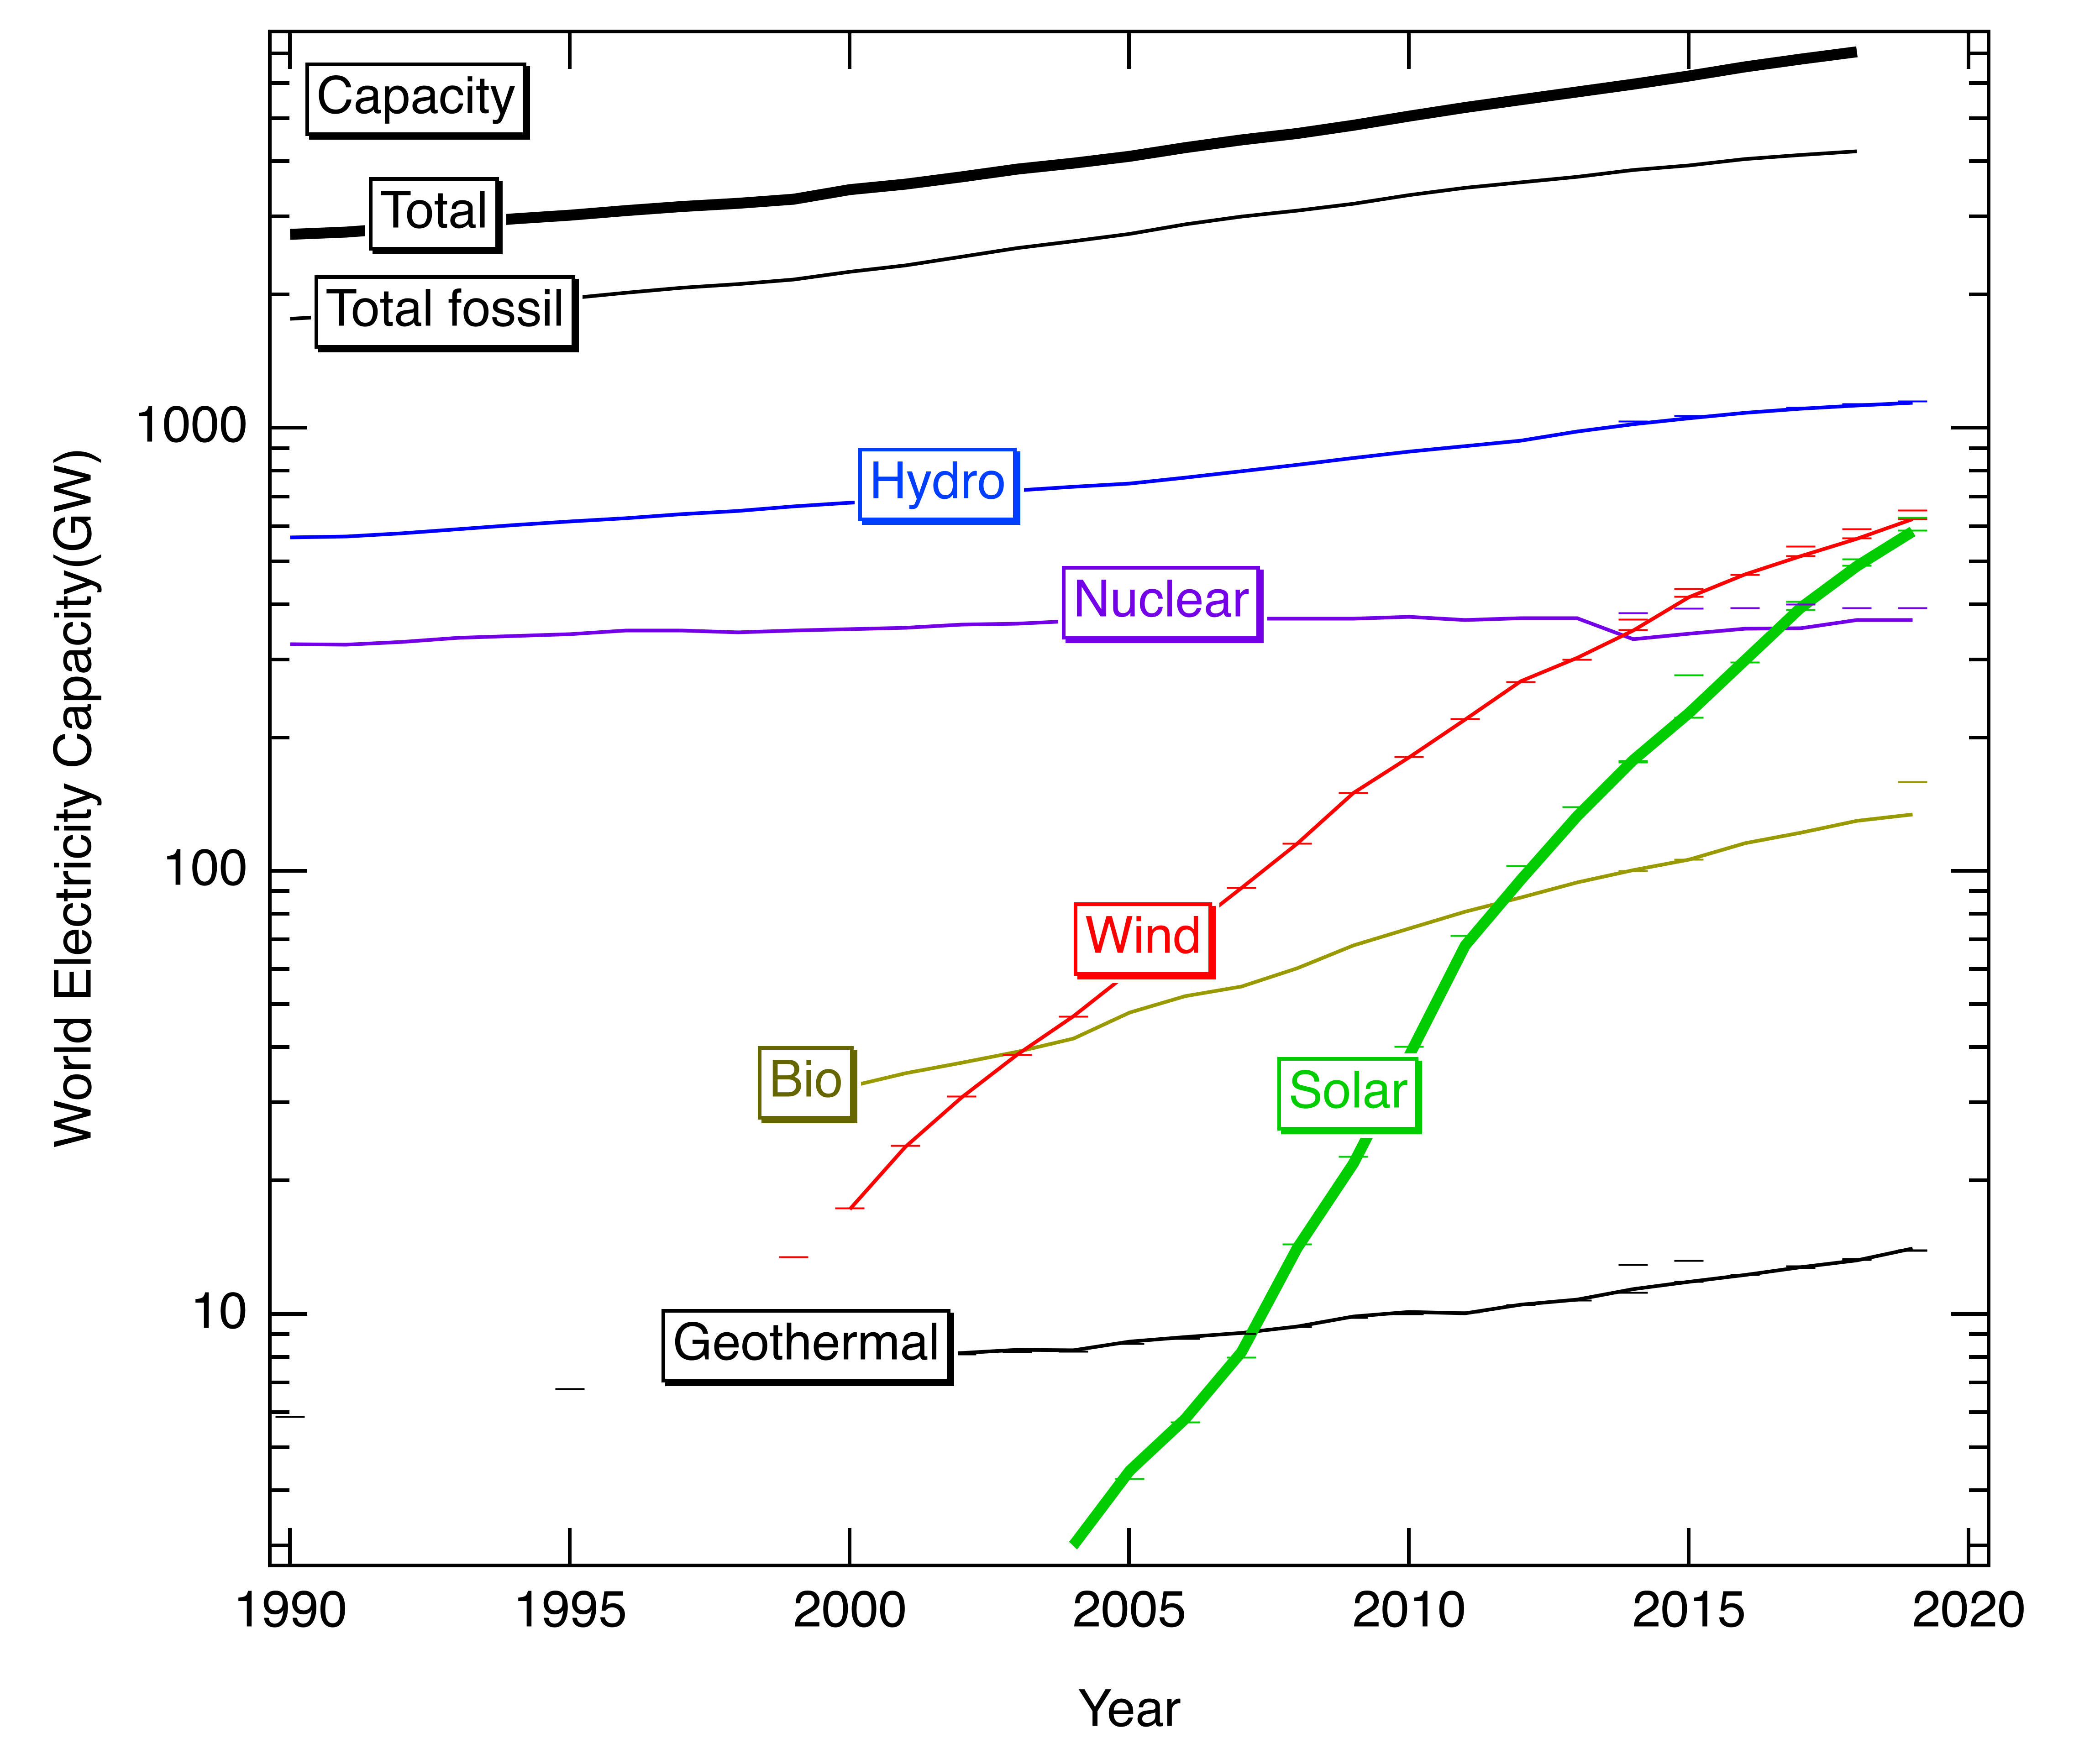
The deployment of capacity to generate electricity is similarly represented below.
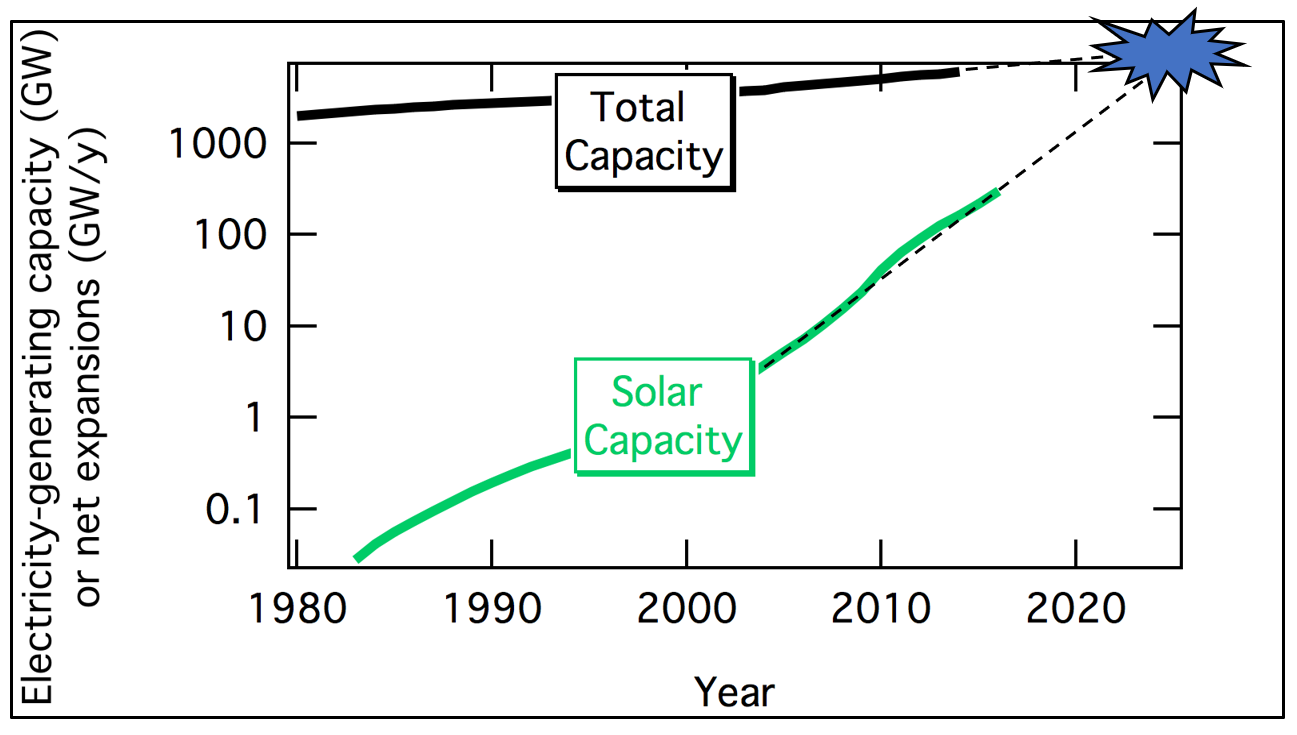
While renewable electricity is still a small fraction of electricity generation, it is now more than half of the net expansions in electricity generating capacity each year as shown by this animation.
We have entered a new era in which the growth of renewables must either slow or we must increase electrification to replace use of fossil fuels for transportation and industrial uses and create demand for installation of more renewable electricity generation. The graph below shows simplistically how extrapolation of recent trends results in solar growing to equal the total capacity in just a few years.
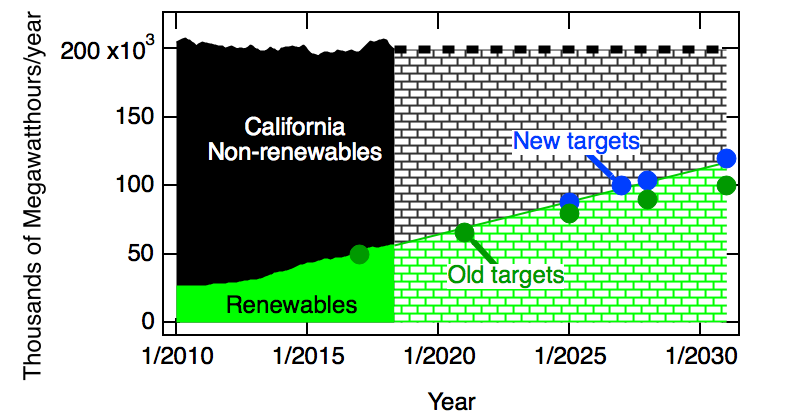
In September 2018, California set targets for 50%-60% renewable electricity in 2026 and 2030, respectively as shown schematically here:
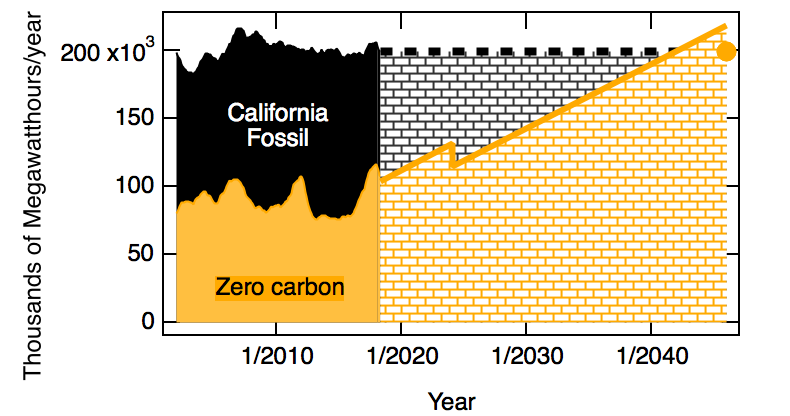
California also set a 100% zero-carbon electricity target for 2045 as shown schematically here:
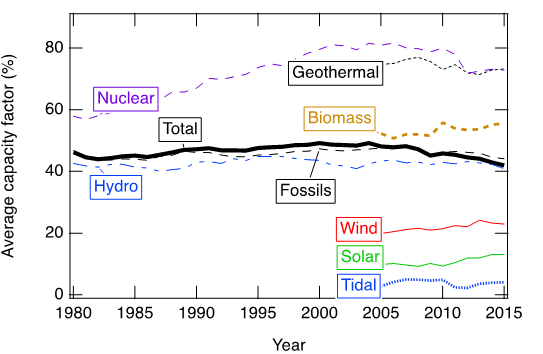
Some plants generate electricity most of the time. Other plants are only turned on when the demand becomes very high. The capacity factor is defined as the fraction of electricity generated relative to what would have been generated if the plant runs at rated power 100% of the time. The trends for the capacity factor for different technologies is shown in the next graph.