
Saliency Detection via Graph-based Manifold Ranking
Chuan Yang1, Lihe Zhang1 , Huchuan Lu1, Xiang Ruan2, and Ming-Hsuan Yang3
1 Dalian University of Technology, 2OMRON Corporation , 3 University of California at Merced


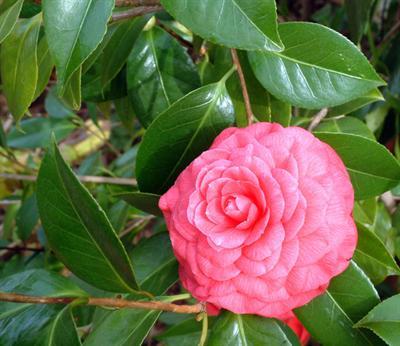
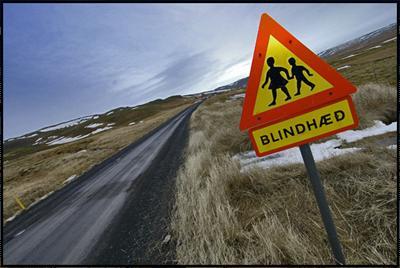
Figure 1. From top to bottom: original image; saliency map and ground truth
Most existing bottom-up methods measure the foreground saliency of a pixel or region based on its contrast within a local context or the entire image, whereas a few methods focus on segmenting out background regions and thereby salient objects. Instead of considering the contrast between the salient objects and their surrounding regions, we consider both foreground and background cues in a different way. We rank the similarity of the image elements (pixels or regions) with foreground cues or background cues via graph-based manifold ranking. The saliency of the image elements is defined based on their relevances to the given seeds or queries. We represent the image as a close-loop graph with superpixels as nodes. These nodes are ranked based on the similarity to background and foreground queries, based on affinity matrices. Saliency detection is carried out in a two-stage scheme to extract background regions and foreground salient objects efficiently. Experimental results on two large benchmark databases demonstrate the proposed method performs well when against the state-of-the-art methods in terms of accuracy and speed. We also create a more difficult benchmark database containing 5,172 images to test the proposed saliency model and make this database publicly available with this paper for further studies in the saliency field.
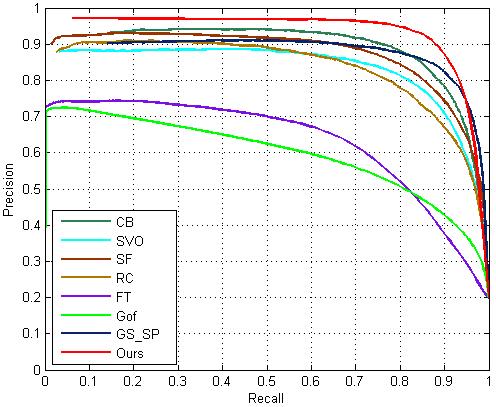
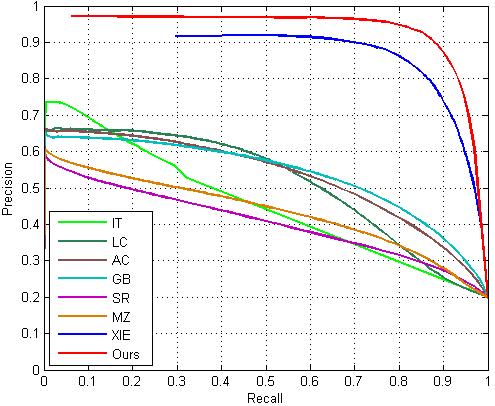
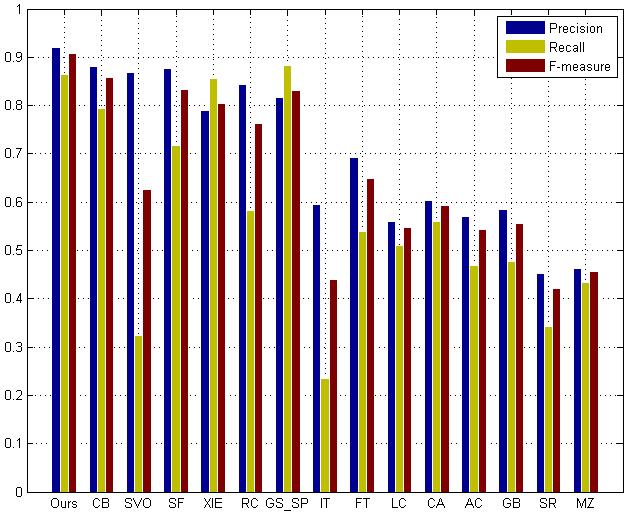
Figure 2. Left, middle: precision-recall curves of different methods. Right: precision, recall and F-measure using an adaptive threshold. All results are computed on the MSRA-1000 dataset. The proposed method performs well in all these metrics.
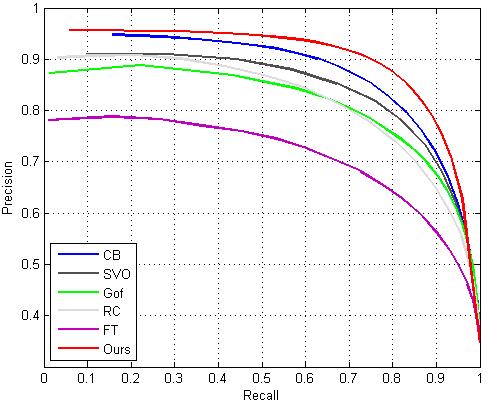
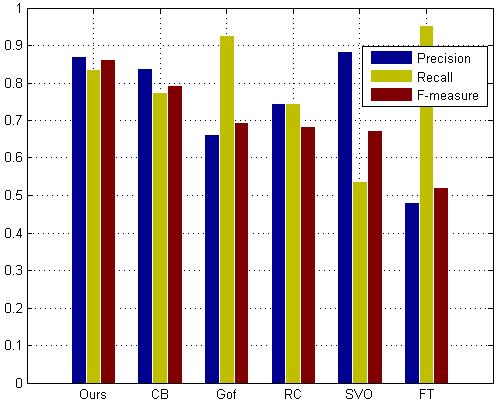
Figure 3. Left: precision-recall curves of different methods. Right: precision, recall and F-measure for adaptive threshold. All results are computed on the MSRA dataset.
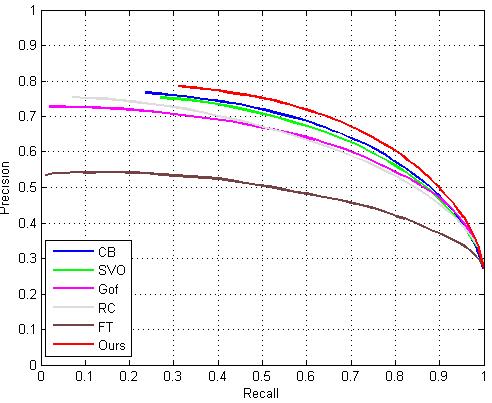
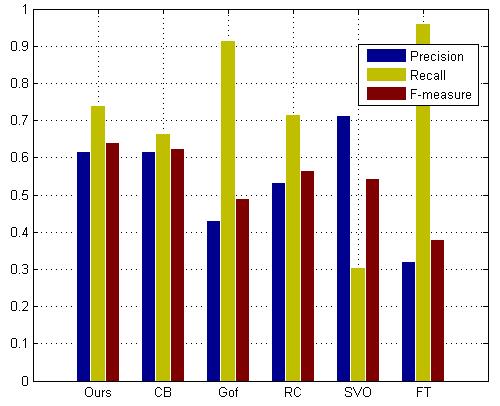
Figure 4. Left: precision-recall curves of different methods. Right: precision, recall and F-measure for adaptive threshold. All results are computed on the DUT-OMRON dataset.
Lihe Zhang, zhanglihe at mail dot dlut dot edu dot cn
Or
Huchuan Lu, lhchuan at mail dot dlut dot edu dot cn
Or
Minghsuan Yang,
mhyang at ucmerced dot edu
-----------------------------------------------------------------
Chuan Yang Last Updated: 2013-03-28 . . .